A lot of the data in PD, particularly after searches, is shown to you in what's called a table or grid view of data - like a spreadsheet of information.
Most of these screens work in the same way, and there are some common features and tips that you may find useful.
•Sorting columns
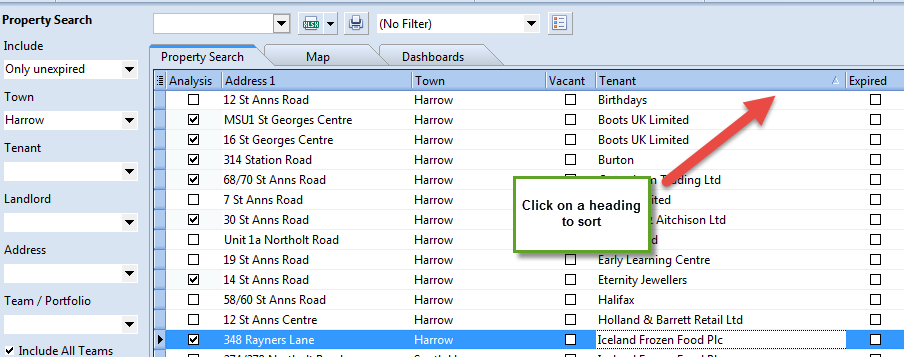
Any column heading can be clicked on and the data will sort in that order. A second click will sort it in reverse order. Shift-clicking will allow you to sort on more than 1 column, eg. Town and then Landlord.
•Filtering Columns
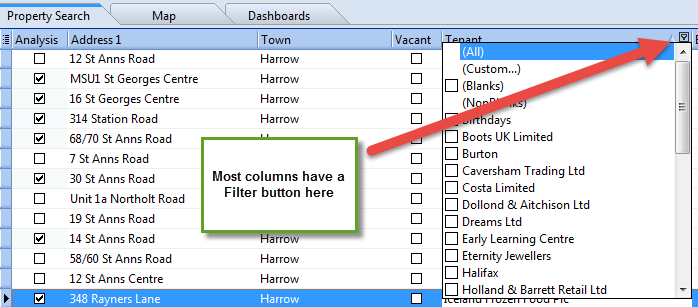
Nearly all search results can then be filtered further by using the filter options at the top of each column - as you move your mouse over a column heading you will see it appear. You can select any combination of values and just those will be included in your revised results.
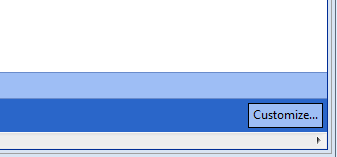
Filters can be removed or temporarily disabled using the Filter controller bar at the bottom of the search results.

You can do even more advanced filters using the "Customize..." button on the filter controller bar.
•Changing the order of columns
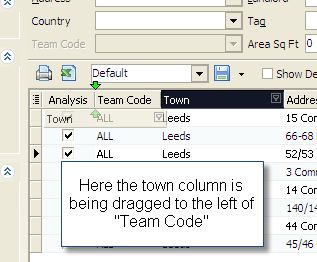
Any columns can be dragged into a different position by clicking and dragging the header.
•Changing which columns are shown
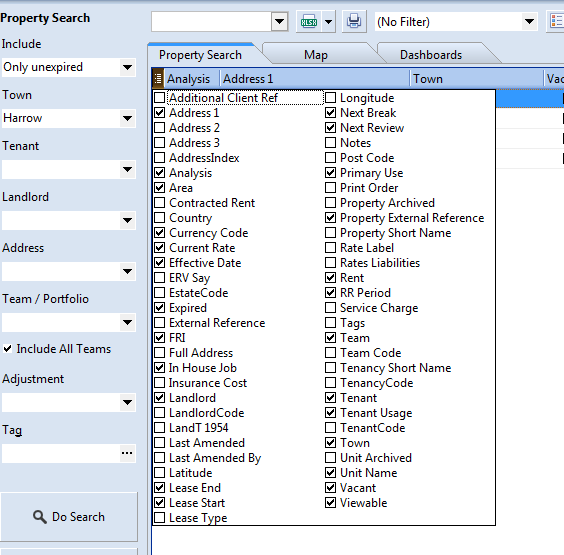
You can choose which columns are shown in the results using the Column selector in the upper left of a grid.
•Grouping by Value
Sometimes for reporting purposes it is useful to visually group related information together. Some of the search screens have a "Group by" functionality which allows this, though it is not enabled by default.
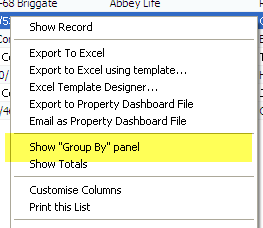
In the Property Search screen, for example, you can right-click on the search results and choose "Show 'Group By' Panel".
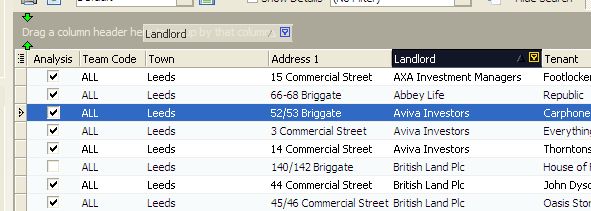
A new area will then appear at the top of the results where you can drag in one or more columns. In the example below "Landlord" is being dropped into that area.
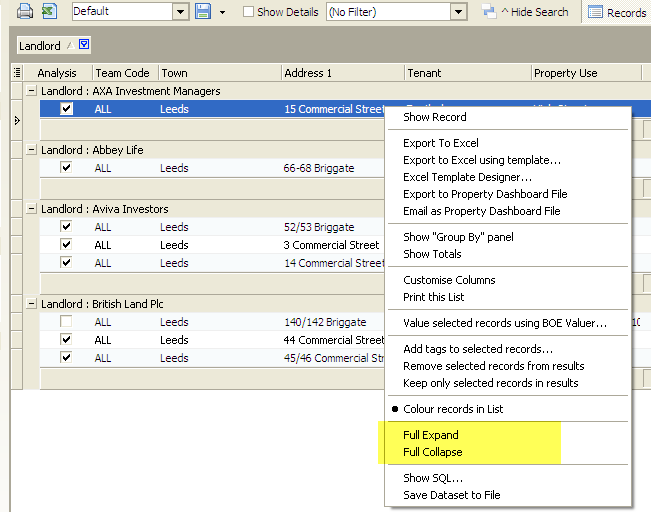
This gives a "nested" view of the data with the data for each landlord name being grouped underneath it. Note there are options for a "Full Expand" or "Full Collapse" of each node.
•Saving views
All of the above is useful but it would be tedious if you had to redo your preferred arrangement each time you start PD. Also, some arrangements will be more appropriate than others depending on your task or the kind of report you're trying to create.
PD allows you to save your own library of column layouts so you can easily switch between them. These are called "Layouts". Moreover, these can be private to you or shared with your colleagues. So if there is a set of fields that are needed for reporting to a particular client, for example, they could be saved as a Company-wide Layout.
To save a view, click on the drop down box in the upper left, usually next to the Excel export icon:
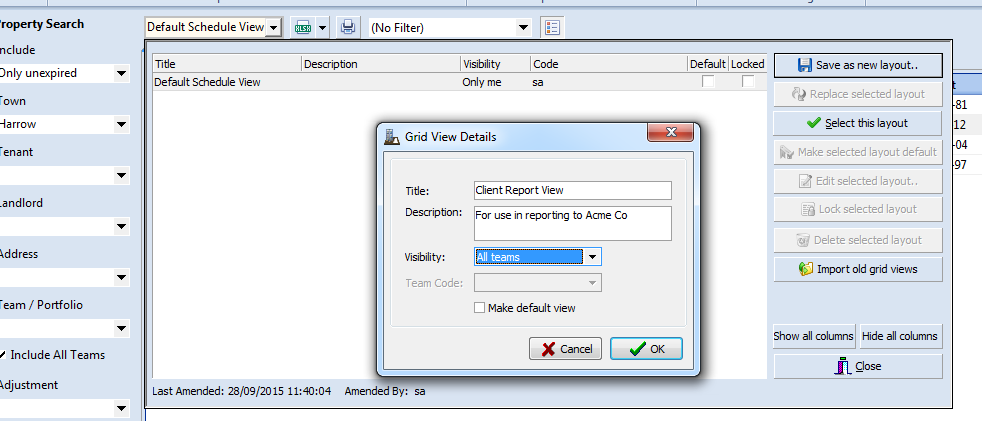
Here you can manage your layouts, including selecting which one should be your default view when first coming into the screen. To choose a different layout, you can either double-click it in the list of use the "Select this layout" button.
•Exporting to Excel
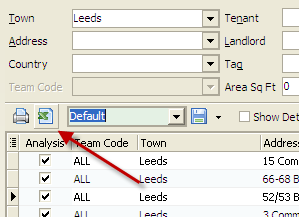
PD offers you two ways of quickly exporting any set of search results into Microsoft Excel. All search screens have an Excel icon in the upper left. This will give you a very quick export which mirrors the arrangement you have on screen, ie. the column selection, their width, any sorting and any filter will be reflected in what's produced.
PD also offers a more advanced export function, which allows you to produce reports into pre-defined templates.
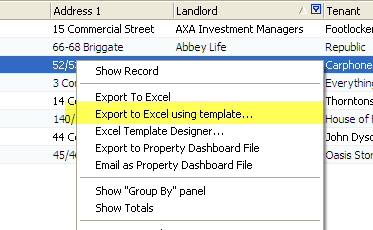
This is a more advanced topic which is covered here.