PD has a powerful data analysis tool called "Dashboards". You can take any set of property search results - eg. a landlord or tenant's portfolio - and produce visual analyses of the properties.
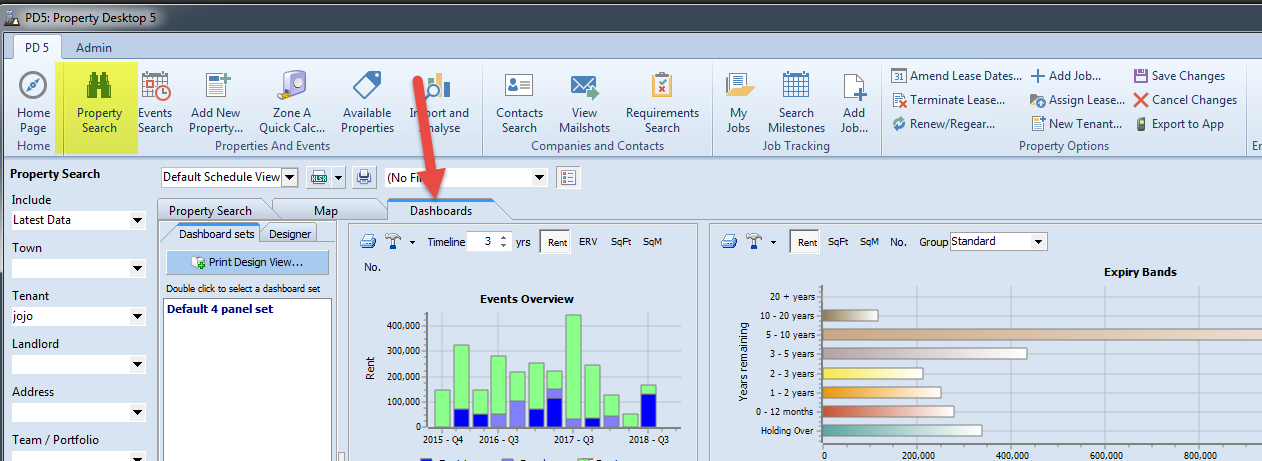
Once you've done your search in the property search screen, select the Dashboads tab along the top of the search screen.

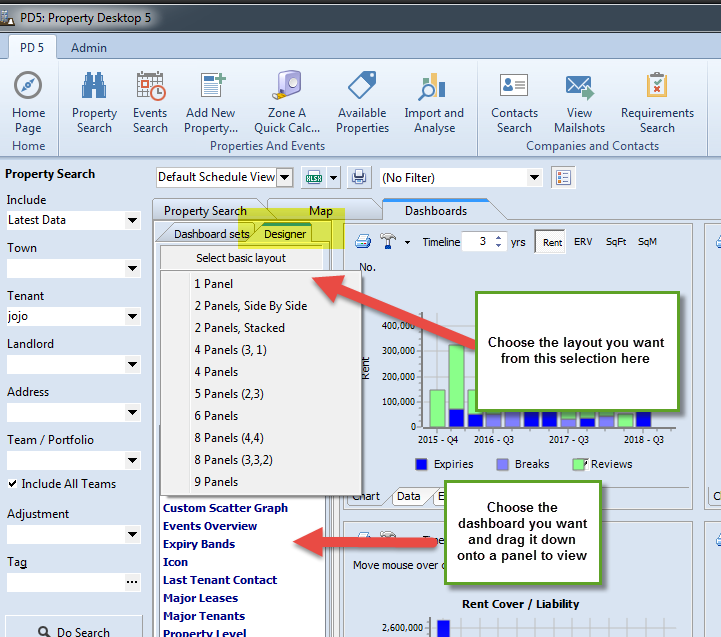
This will bring up a screen with a default set of dashboard showing various lease metrics. You can customise the layout and content of this screen.

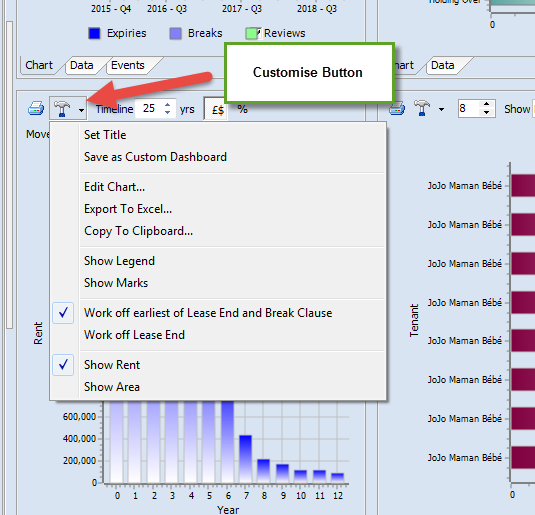
Most dashboards can be extensively customised to show different chart types or data series:

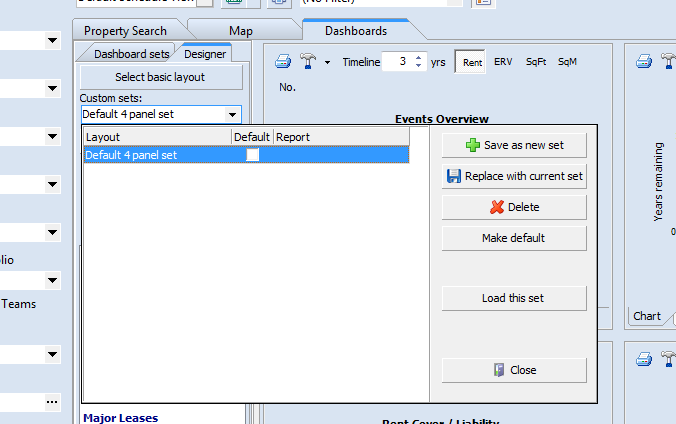
Any layout you want to keep can be saved a set for future use:
